
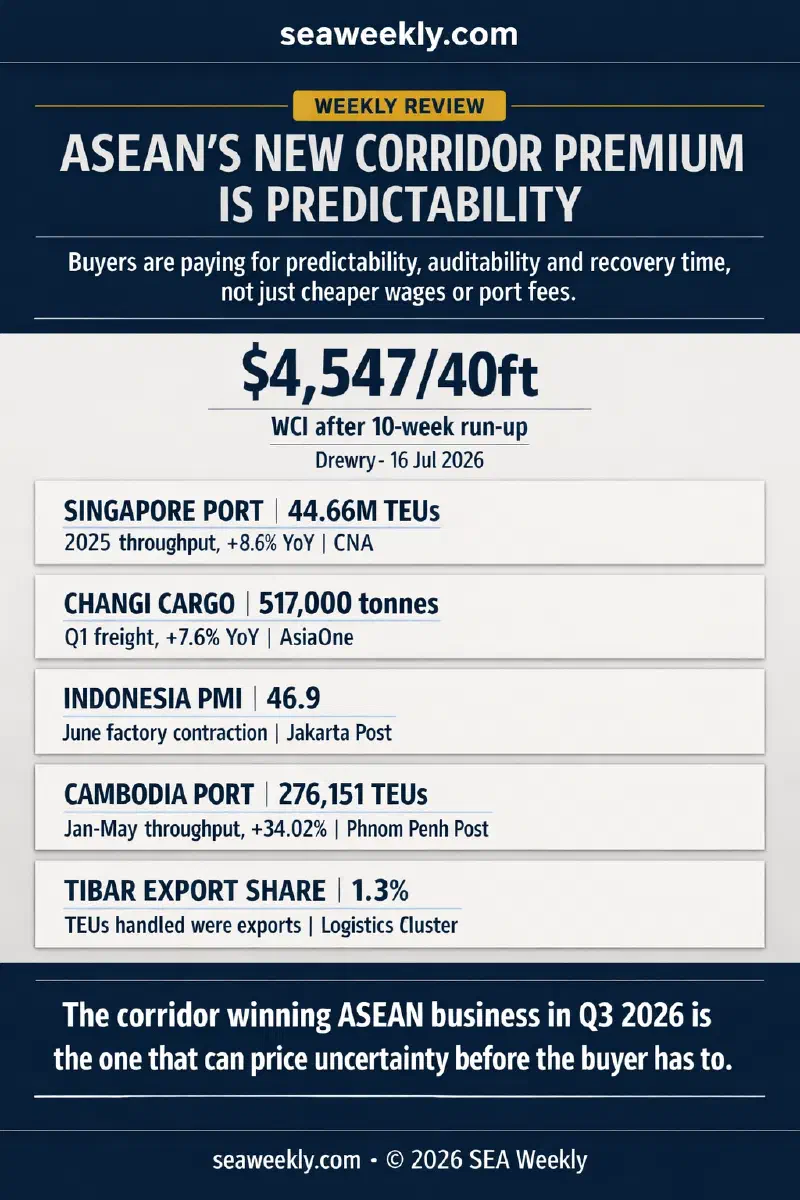
The most important price in ASEAN logistics this week was not Drewry’s $4,547 benchmark. It was the extra amount a buyer was willing to pay to avoid discovering a corridor’s weakness after the cargo had already moved.
That is the sharper way to read the five country stories SEA Weekly published this week. Q3 corridor competition is no longer dividing Southeast Asia into cheap and expensive routes. It is dividing the region into routes that can quote a predictable total cost, routes that can buy a selective hedge, and routes that still discover their true price only after the delay, rerouting, audit friction, or inland breakdown shows up on the balance sheet. Drewry’s July 16 World Container Index, still elevated at $4,547 per 40ft even after a 2 percent weekly dip, is only the background rate card (Drewry, 16 Jul 2026). The actual cost map sits one layer deeper.

The market is now paying for recovery time #
DHL’s July ocean update is blunt: global container demand is up 4 percent year to date, effective capacity is still constrained by congestion and Suez detours, and freight rates are 84 percent above last year (DHL, July 2026). The mistake is to read that as a simple shortage-of-ships story. It is a recoverability story. There are enough ships to keep trade moving. There are not enough clean, predictable recovery paths when one leg of a route fails.
Portcast’s July 14 congestion snapshot shows how wide the spread has become. Jeddah was at 4.24 days of median waiting time, Sohar at 3.54 days, and Manila South Harbor at 2.94 days, while Singapore sat at 0.12 days in low-congestion territory (Portcast, 14 Jul 2026). That difference is no longer a technical footnote for shipping managers. It is a pricing input for buyers deciding whether a corridor can absorb a bad week without forcing a new production plan.
This extends a line I have been tracing since June 29’s freight-cost analysis and the July 4 SEA Weekly. Back then, the point was that freight shocks hit margins before they hit volumes. This week shows the next stage. Once the freight shock stays elevated long enough, buyers stop pricing only the shipment. They start pricing the corridor behind it.
What this week’s corridors actually sold #
Monday’s Timor-Leste piece offered the cleanest negative example. Tibar Bay now has the hardware of a serious port: 630 metres of quay, 16 metres of draft, 27 hectares of stockyard, and theoretical annual capacity of 1 million TEU (Timor Port). But the port handled only 58,267 TEU in the period covered by the Logistics Cluster assessment, and just 1.3 percent of that volume was exports (Logistics Cluster / WFP, 2026). The inland system explains why. Timor-Leste still has only 2,600 kilometres of paved road out of a 6,941-kilometre network, with landslides and flood damage regularly cutting routes during the rainy season (Logistics Cluster / WFP, 2026). ADB’s $78 million road package signed in December was necessary precisely because Timor-Leste is still financing the minimum inland conditions a corridor needs before it can sell reliability (ADB, 15 Dec 2025). The country has a modern berth. It does not yet have a corridor a procurement team can treat as self-sustaining.
Tuesday’s Thailand-Indonesia comparison showed the opposite problem. Thailand is not cheap, and Laem Chabang’s congestion premium is real. But Thailand’s penalty is visible and modelable. Indonesia’s June PMI at 46.9, the steepest drop in export orders since August 2021, and industry complaints that logistics costs had risen 103 to 109 percent describe a route whose delivered cost is moving faster than a buyer’s spreadsheet can update (The Jakarta Post, 1 Jul 2026; The Jakarta Post, 2 Jul 2026). Hyundai’s decision to export Thailand-built battery electric vehicles to Australia matters for that reason, not because one auto program changes the map by itself. It is evidence that buyers will pay a predictability premium before they pay for a nominally cheaper but volatile corridor (Bangkok Post, 13 Jul 2026).
Wednesday’s Vietnam analysis captured a third pricing model: hedge instead of certainty. DHL’s June air freight update showed global spot rates at $3.75 per kilogram, 47 percent above last year, while Asia capacity stayed tight despite growth (DHL, June 2026). That is punitive pricing for low-margin cargo. It is rational pricing for semiconductors, electronics, and urgent industrial inputs if the air slot protects a production window. CEVA’s new Hanoi-Chicago charter, running three times a week on Boeing 777 freighters with up to 100 tons per flight, is not a cheap-freight story. It is a controlled-capacity story (AJOT, 24 Jun 2026). FedEx’s March reading that Vietnam handled about 1.3 million metric tons of air cargo in 2025, up 22 percent, and that electronics account for more than one-third of exports explains why the hedge exists at all (FedEx, 20 Mar 2026). Vietnam is not eliminating the ocean penalty. It is buying an escape hatch for the highest-value slice of its export basket.
Thursday’s Cambodia-Myanmar sourcing piece showed a fourth model: auditability as cost advantage. Phnom Penh Autonomous Port handled 276,151 TEU in January-May, up 34.02 percent year on year, while cargo and fuel volumes rose 10.7 percent (Phnom Penh Post, 16 Jun 2026). At the same time, the World Bank still described Cambodian exports as buoyant, up 17.7 percent in the first quarter, even as inflation hit 5.8 percent and fuel shocks squeezed households and firms (World Bank, 9 Jun 2026). That is not a frictionless corridor. It is a corridor that remains legible enough for a sourcing committee to approve. In 2026, that is a commercial asset in its own right.
Friday’s Singapore piece showed where the Q3 premium ends up being monetised. The Port of Singapore handled 44.66 million TEU in 2025, up 8.6 percent, with 3.22 billion gross tonnage of vessel arrivals and 56.77 million tonnes of marine fuel sales (CNA, 13 Jan 2026). Changi moved 517,000 tonnes of airfreight in the first quarter of 2026, up 7.6 percent, even with Middle East traffic disrupted (AsiaOne, 17 Apr 2026). MAS put the financial layer plainly: the sector contributes about 14 percent of GDP, employs around 200,000 people, and managed S$6.7 trillion in assets at end-2025 (MAS, 25 Jun 2026). Singapore is not making Q3 volatility disappear. It is charging for the ability to route around it across sea, air, yard, and balance sheet.
The new hierarchy inside the Q3 cost map #
Put together, the week’s five pieces suggest that ASEAN’s corridor competition is now being priced on a ladder.
At the top sits Singapore, which sells recovery time. When a route breaks, the value is not lower nominal freight. The value is having port, air, and finance layers close enough to compress the delay.
Thailand is the predictable-premium route. Its costs are not low, but they are visible enough that procurement teams can budget them.
Vietnam is building a selective hedge. Its advantage is not universal. It belongs to exporters with value density high enough to justify buying air optionality when ocean schedules fail.
Cambodia is the bankable low-cost corridor. It does not win because it is immune to fuel or freight stress. It wins because the corridor can still be audited, insured, and cleared with less argument than weaker rivals.
Timor-Leste remains pre-premium. The port is real; the corridor is still being assembled. It may become strategically important later. It cannot yet sell the full service a buyer now wants.
Indonesia is the warning embedded inside this week’s map. A lower wage line and a large domestic market do not protect a corridor whose delivered cost has become unstable. Once buyers start paying for predictability, low nominal cost stops being the same thing as competitiveness.
Where this arc connects #
This is also where the editorial line tightens. June 29’s article on freight costs and margins argued that rising rates hit P&Ls before trade volumes crack. My July 4 SEA Weekly argued that ASEAN’s supply-chain repricing was already reshaping Q3 expectations before corporate guidance caught up. Chloe Tan’s July 11 SEA Weekly then pushed the thesis outward: logistics and freight signals were becoming the leading indicators for H2 growth. This week’s corridor reporting adds the operational proof. Buyers are no longer just paying a freight premium. They are ranking ASEAN corridors by how much uncertainty each one can absorb on demand.
What to watch next is not simply whether the WCI prints $4,700 or $4,300 next Thursday. It is whether H2 sourcing matrices start treating air slots, port-adjacent warehousing, customs speed, inland road integrity, and financing access as one delivered-cost line rather than five separate operating details. If that shift sticks, the Q3 hierarchy will harden into 2027 contract allocation long before most macro data acknowledges it.
References:
- Drewry (July 16, 2026). “World Container Index - 16 Jul.” https://www.drewry.co.uk/supply-chain-advisors/supply-chain-expertise/world-container-index-assessed-by-drewry (Accessed July 18, 2026)
- DHL Global Forwarding (July 2026). “Ocean Freight Market Update.” https://www.dhl.com/th-en/home/global-forwarding/latest-news-and-webinars/ocean-freight-market-update.html (Accessed July 18, 2026)
- Portcast (July 14, 2026). “Port Congestion Snapshot: Live Vessel Wait Times (Updated Weekly).” https://www.portcast.io/blog/port-congestion-snapshot (Accessed July 18, 2026)
- Timor Port. “Terminal Capacity.” https://www.timorport.com/services/terminal-capacity/ (Accessed July 18, 2026)
- Logistics Cluster / WFP (2026). “2.1.2 Timor-Leste Port of Tibar Bay.” https://lca.logcluster.org/212-timor-leste-port-tibar-bay (Accessed July 18, 2026)
- Logistics Cluster / WFP (2026). “2.3 Timor-Leste Road Network.” https://lca.logcluster.org/23-timor-leste-road-network (Accessed July 18, 2026)
- Asian Development Bank (December 15, 2025). “ADB, Timor-Leste Sign $78 Million Financing to Upgrade National Road Network.” https://www.adb.org/news/adb-timor-leste-sign-78-million-financing-upgrade-national-road-network (Accessed July 18, 2026)
- The Jakarta Post / Divya Karyza (July 1, 2026). “RI factories slide into contraction in June amid soaring costs, weak demand.” https://www.thejakartapost.com/business/2026/07/01/ri-factories-slide-into-contraction-in-june-amid-soaring-costs-weak-demand (Accessed July 18, 2026)
- The Jakarta Post (July 2, 2026). “Businesses urge easing of quarantine rules amid rising logistics costs.” https://www.thejakartapost.com/business/2026/07/02/businesses-urge-easing-of-quarantine-rules-amid-rising-logistics-costs (Accessed July 18, 2026)
- Bangkok Post (July 13, 2026). “Hyundai to export Thai BEVs to Australia.” https://www.bangkokpost.com/business/motoring/3285127/hyundai-to-export-thai-bevs-to-australia (Accessed July 18, 2026)
- AJOT (June 24, 2026). “CEVA boosts Asia Pacific-U.S. air cargo with two charters connecting Vietnam, China to U.S.” https://www.ajot.com/news/ceva-boosts-asia-pacific-u.s-air-cargo-with-two-charters-connecting-vietnam-china-to-u.s (Accessed July 18, 2026)
- DHL Global Forwarding (June 2026). “Air Freight Market Update.” https://www.dhl.com/vn-en/home/global-forwarding/latest-news-and-webinars/air-freight-market-update.html (Accessed July 18, 2026)
- FedEx (March 20, 2026). “Vietnam’s Air Cargo Growth: Opportunities For Exporters And Manufacturers.” https://www.fedex.com/en-sg/business-insights/tech-innovation/vietnam-air-cargo-growth-opportunities.html (Accessed July 18, 2026)
- VietnamPlus / VNA (June 29, 2026). “Vietnam Airlines targets profit despite soaring fuel costs.” https://en.vietnamplus.vn/vietnam-airlines-targets-profit-despite-soaring-fuel-costs-post347359.vnp (Accessed July 18, 2026)
- Phnom Penh Post / Hin Pisei (June 16, 2026). “Phnom Penh port sees container throughput surge by more than one-third.” https://phnompenhpost.com/business/phnom-penh-port-sees-container-throughput-surge-by-more-than-one-third/ (Accessed July 18, 2026)
- World Bank (June 9, 2026). “Strong Policy Action Key to Protecting Cambodia’s Jobs and Livelihoods Amid Shocks.” https://www.worldbank.org/en/news/press-release/2026/06/09/strong-policy-action-key-to-protecting-cambodia-s-jobs-and-livelihoods-amid-shocks (Accessed July 18, 2026)
- Channel News Asia (January 13, 2026). “Singapore sees record port performance in 2025.” https://www.channelnewsasia.com/singapore/singapore-sees-record-port-performance-in-2025-5855836 (Accessed July 18, 2026)
- AsiaOne (April 17, 2026). “Changi Airport handled 17.6 million passengers in Q1 amid strong demand for North Asia, Europe.” https://www.asiaone.com/singapore/changi-airport-q1-2026-passenger-cargo-demand (Accessed July 18, 2026)
- Monetary Authority of Singapore (June 25, 2026). “Singapore as a Trusted Connector in a Changing World.” https://www.mas.gov.sg/news/speeches/2026/singapore-as-a-trusted-connector-in-a-changing-world (Accessed July 18, 2026)