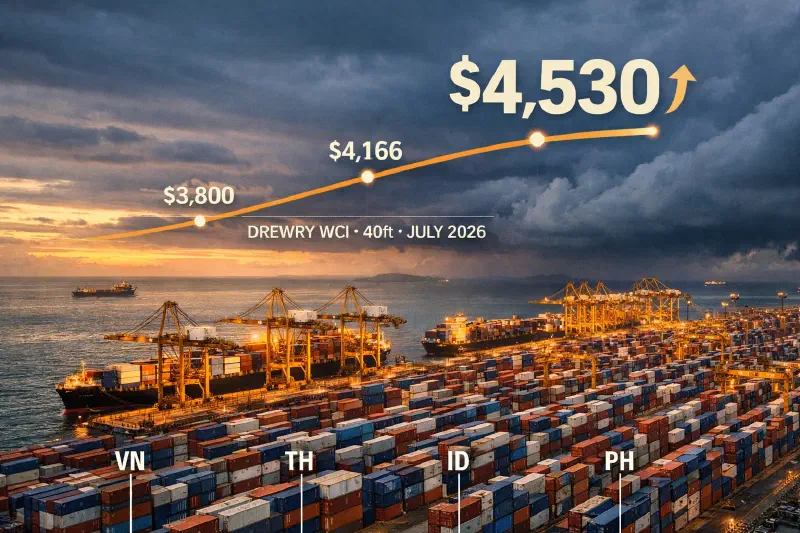
This was supposed to be the week the supply chain story settled. The US-Iran ceasefire was holding, Strait of Hormuz traffic was recovering under newly designated transit routes, and the working assumption in most procurement teams was that the June freight spike had found its ceiling. Then Drewry’s World Container Index printed $4,530 on Thursday — up 9% in a single week from the $4,166 that opened this cycle — with eight blank sailings announced on the Transpacific and HMM implementing a $3,000 peak-season surcharge effective July 15 (Drewry, 2 Jul 2026).
The rate does not have a ceiling in sight. What it does have is a set of consequences that are landing across ASEAN before the data confirms them — and the five articles SEAWeekly ran this week, read as a sequence, show what those consequences look like on the ground.
What the week’s articles found when read in sequence #
Monday’s piece on ASEAN freight cost squeeze established the mechanism that would run through every subsequent article: exporters do not cancel orders when freight costs rise. They keep shipping and absorb the margin hit, because the cost of a disrupted buyer relationship — lost shelf position, missing next-season allocation, damaged key account scores — exceeds the near-term cost of absorbing the freight premium. Volume holds. Gross returns thin. The headline trade numbers look resilient for weeks after the real damage is done.
Tuesday’s Vietnam report showed that the same logic runs through the order-book layer. Vietnam’s May PMI at 52.8 looked like a recovery confirmation. The export sub-index — the part tracking international demand rather than domestic restocking — rose only marginally, with S&P Global explicitly attributing the weakness to high transportation costs and logistics issues limiting international demand. Manufacturing employment fell for the third consecutive month. Factories are running lean, waiting for committed order books before scaling up. The committed order books have not yet arrived at the depth the H2 recovery thesis requires.
Wednesday’s Thailand article introduced the physical layer. Laem Chabang, which handles roughly 70% of Thailand’s container throughput, entered the peak monsoon window with berth queuing premiums of $50–150 per container already active — not because of the monsoon, but because the port has been running near maximum design capacity for three consecutive years. Thai automotive output was down 17.94% year on year in May. That might be expected to reduce port pressure by lowering inbound cargo volumes. It does not: automotive component pipelines run on long-lead schedules, meaning the production downturn continues drawing down pre-ordered inventory for weeks after output numbers are revised. Thailand is entering its most dangerous Q3 supply chain window in years with its buffers already consumed.
Friday’s Indonesia analysis completed the picture with the case for why Indonesia faces a structurally heavier cost stack than its ASEAN peers. Global freight shock, monsoon-season inter-island shipping delays across the Banda and Flores seas, and government policy conflicts between HPM benchmark maximisation and downstream investment returns are not arriving in sequence. They are arriving simultaneously — and that simultaneity is the event, not the sum of its parts.
The week’s diagnostic data point #
The number that deserved more attention than it received was not the Drewry WCI and not the Philippines inflation estimate. It was Indonesia’s manufacturing PMI.
The S&P Global Indonesia reading dropped to 46.9 in June from 50.0 in May, marking the sharpest manufacturing contraction in a year (The Jakarta Post, 1 Jul 2026). New export orders posted their steepest decline since August 2021. Input prices hit their highest level since September 2013. Job shedding was the most severe since September 2021. The reading landed while the rest of ASEAN held above 50.
That divergence is the diagnostic point. Indonesia is not contracting because ASEAN demand is weak. It is contracting because the cost push landing on Indonesia is specifically severe. The Indonesian Employers Association told the Quarantine Agency that logistics costs have risen 103 to 109 percent from geopolitical shocks alone (The Jakarta Post, 2 Jul 2026). Layer onto that the HPM-linked input cost increases for nickel and commodity downstream processors, and you get a cost architecture that is pricing Indonesian goods out of international markets at the exact moment when ASEAN peers are holding or gaining position.
Danantara’s merger of seven state-owned logistics SOEs announced this week is the right structural response (Antara, 1 Jul 2026). It will not produce efficiency gains at the dock gate before the Q3 monsoon window closes. The policy architecture that created part of the cost problem — HPM maximisation that conflicts with the processing-spread economics of downstream investment — has not yet been examined with the same urgency. That remains the harder conversation.
The Philippines macro-micro paradox #
Thursday’s Philippines article produced the week’s starkest moment of cognitive dissonance. The World Bank reclassified the Philippines as an upper-middle income country. At almost the same time, the Bangko Sentral ng Pilipinas estimated June inflation at 6 to 7 percent — above its target band for the fourth consecutive month (Philippine Daily Inquirer, 1 Jul 2026) — and LenderLink’s credit data showed the P5,000–P10,000 digital loan bracket carrying a 42 percent delinquency rate (Philippine Daily Inquirer, 2 Jul 2026).
These are not contradictory facts. They are the same economy described at different layers of aggregation.
The Philippines faces a freight inflation mechanism most ASEAN economies do not. Container rate increases reach retail shelves through two separate passes: first at Manila’s international arrival point, then again through the inter-island roll-on roll-off network that distributes goods across 7,641 islands. Bunker fuel prices — which have moved with the Hormuz disruption — feed directly into that second pass on a lag shorter than the standard import-to-retail cycle. The Drewry spike from late June will begin arriving in Philippine food prices in roughly late August and landing fully in September and October. The households least protected are remittance-dependent families in the provinces, whose April OFW inflows were already running at an 11-month low at approximately $2.7 billion (Philippine Daily Inquirer, 1 Jul 2026).
The 12 percent minimum wage increase approved for Metro Manila workers delivers roughly 5 percent in real purchasing power at 6.5 percent inflation — for the workers it covers (VnExpress International, 2 Jul 2026). The families most exposed to food import inflation are not primarily Metro Manila formal-sector employees. The 12 percent increase does not reach them.
That gap — between the income level the World Bank now measures and the household budget reality that the digital delinquency data reveals — is precisely where the supply chain repricing lands hardest.
Vietnam as the sorting mechanism #
The positive counterweight to this week’s cost story is also a Vietnam story.
The US-Vietnam customs data exchange signed in Brussels on June 25 — a real-time electronic cargo manifest sharing agreement — creates institutional infrastructure that changes the H2 order-book conversation for manufacturers operating in compliant industrial parks (Vietnam Investment Review, 26 Jun 2026). US buyers who have been pricing in origin-compliance risk now have, for the first time, an architecture that removes ambiguity from one side of that calculation. Compliant factories in VSIP, Yen Phong, and Becamex’s Binh Duong clusters stand to benefit from improved forward order commitment — not because demand improved but because compliance uncertainty reduced.
That does not solve the freight cost problem. It does mean that the Q3 repricing is creating a sorting mechanism inside Vietnam’s manufacturing base, not just applying uniform pressure across it. The FDI data — Coherent expanding its Dong Nai footprint, Interflex raising its PCB stake, Becamex committing $5.1 billion across five years — is the revealed signal that the constructive reading of Vietnam’s $18 billion trade swing is not wishful thinking. Those commitments were made by companies whose customers gave them production requirements. The import surge is pre-positioned inventory for an order wave that has not yet shown up in the PMI export sub-index.
Whether that wave materialises before the freight cost environment compounds further is the test that will define Vietnam’s H2 export story.
What the rate curve says about Q3 #
The Drewry July 2 reading at $4,530 means that every piece of analysis published this week — including my own Monday article — was written against a rate benchmark that had already been displaced before readers saw it. HMM’s $3,000 peak-season surcharge taking effect July 15 is the next data point on a curve that Drewry still describes as pointing upward.
In the June 13 SEA Weekly, the argument was that ASEAN supply chain risk was repricing along two independent axes — energy cost and governance risk — and the two vectors were not cancelling each other out. The July picture is a third axis: sustained freight rate inflation compounding into the margin structures of exporters who were already navigating the first two.
What to watch in Q3 is not trade volumes. They will hold, as exporters absorb rather than cancel. What to watch is the behaviour that signals the real cost is landing: earlier space bookings, higher inventory buffers, vendor consolidation, and — most legibly — second-half guidance revisions from companies whose supply chains are exposed to high-freight-sensitive product lines.
By the time those revisions arrive, the July rate environment will be two months into price pass-through that is already irreversible. The gap between what the data currently shows and what the balance sheets are absorbing is the most important space in ASEAN supply chain analysis right now. This week’s articles mapped it from five different directions. None of the five maps are reassuring.
References:
- Drewry (July 2, 2026). “World Container Index — 02 Jul.” https://www.drewry.co.uk/supply-chain-advisors/supply-chain-expertise/world-container-index-assessed-by-drewry (Accessed July 4, 2026)
- The Jakarta Post / Divya Karyza (July 1, 2026). “RI factories slide into contraction in June amid soaring costs, weak demand.” https://www.thejakartapost.com/business/2026/07/01/ri-factories-slide-into-contraction-in-june-amid-soaring-costs-weak-demand (Accessed July 4, 2026)
- The Jakarta Post (July 2, 2026). “Businesses urge easing of quarantine rules amid rising logistics costs.” https://www.thejakartapost.com/business/2026/07/02/businesses-urge-easing-of-quarantine-rules-amid-rising-logistics-costs (Accessed July 4, 2026)
- Antara (July 1, 2026). “Danantara merges seven logistics SOEs to boost efficiency, cut costs.” https://en.antaranews.com/news/420965/danantara-merges-seven-logistics-soes-to-boost-efficiency-cut-costs (Accessed July 4, 2026)
- Philippine Daily Inquirer / Ian Nicolas P. Cigaral (July 1, 2026). “BSP: Inflation likely eased in June to 6-7%.” https://business.inquirer.net/598120/bsp-inflation-likely-eased-in-june-to-6-7 (Accessed July 4, 2026)
- Philippine Daily Inquirer / Ian Nicolas P. Cigaral (July 1, 2026). “ING: PH trails Asia in consumer recovery.” https://business.inquirer.net/598126/ing-ph-trails-asia-in-consumer-recovery (Accessed July 4, 2026)
- Philippine Daily Inquirer / Logan Kal-El M. Zapanta (July 2, 2026). “Filipinos taking smaller, more frequent loans — study.” https://business.inquirer.net/598264/filipinos-taking-smaller-more-frequent-loans-study (Accessed July 4, 2026)
- VnExpress International (July 2, 2026). “Philippines approves record 12% minimum wage hike for Manila workers.” https://e.vnexpress.net/news/business/economy/philippines-approves-record-12-minimum-wage-hike-for-manila-workers-5092134.html (Accessed July 4, 2026)
- Vietnam Investment Review (June 26, 2026). “Vietnam and US launch real-time customs data exchange to enhance transparency.” https://vir.com.vn/vietnam-and-us-launch-real-time-customs-data-exchange-to-enhance-transparency-155568.html (Accessed July 4, 2026)
- SEAWeekly / Miguel Santos (June 29, 2026). “How ASEAN freight costs are squeezing supply chain margins as Q3 shipping rates climb.” https://seaweekly.com/posts/2026-06-29-asean-freight-costs-squeezing-supply-chain-margins/ (Accessed July 4, 2026)
- SEAWeekly / Nguyen Minh An (June 30, 2026). “Why Vietnam factory order visibility is the key test for ASEAN export recovery in H2 2026.” https://seaweekly.com/posts/2026-06-30-vietnam-factory-order-visibility-asean-export-recovery/ (Accessed July 4, 2026)
- SEAWeekly / Pichaya Srisuk (July 1, 2026). “What’s driving Thailand port congestion risk ahead of peak monsoon shipping season?” https://seaweekly.com/posts/2026-07-01-thailand-port-congestion-monsoon-shipping-season/ (Accessed July 4, 2026)
- SEAWeekly / Maria Lourdes Reyes (July 2, 2026). “How Philippines food import inflation is challenging household spending resilience in H2 2026.” https://seaweekly.com/posts/2026-07-02-philippines-food-import-inflation-household-spending-h2-2026/ (Accessed July 4, 2026)
- SEAWeekly / Marcus Wijaya (July 3, 2026). “Why Indonesia nickel logistics face downstream cost pressures in the H2 supply chain cycle.” https://seaweekly.com/posts/2026-07-03-indonesia-nickel-logistics-downstream-cost-pressures-h2-supply-chain/ (Accessed July 4, 2026)
- SEAWeekly / Miguel Santos (June 13, 2026). “SEA Weekly: What’s driving ASEAN supply chain risk repricing across frontier markets.” https://seaweekly.com/posts/2026-06-13-sea-weekly-asean-supply-chain-risk-repricing-frontier-markets/ (Accessed July 4, 2026)