
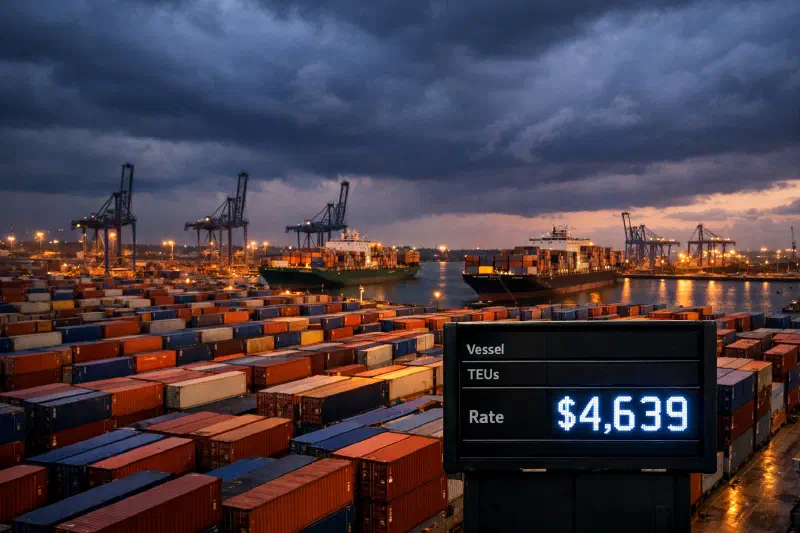
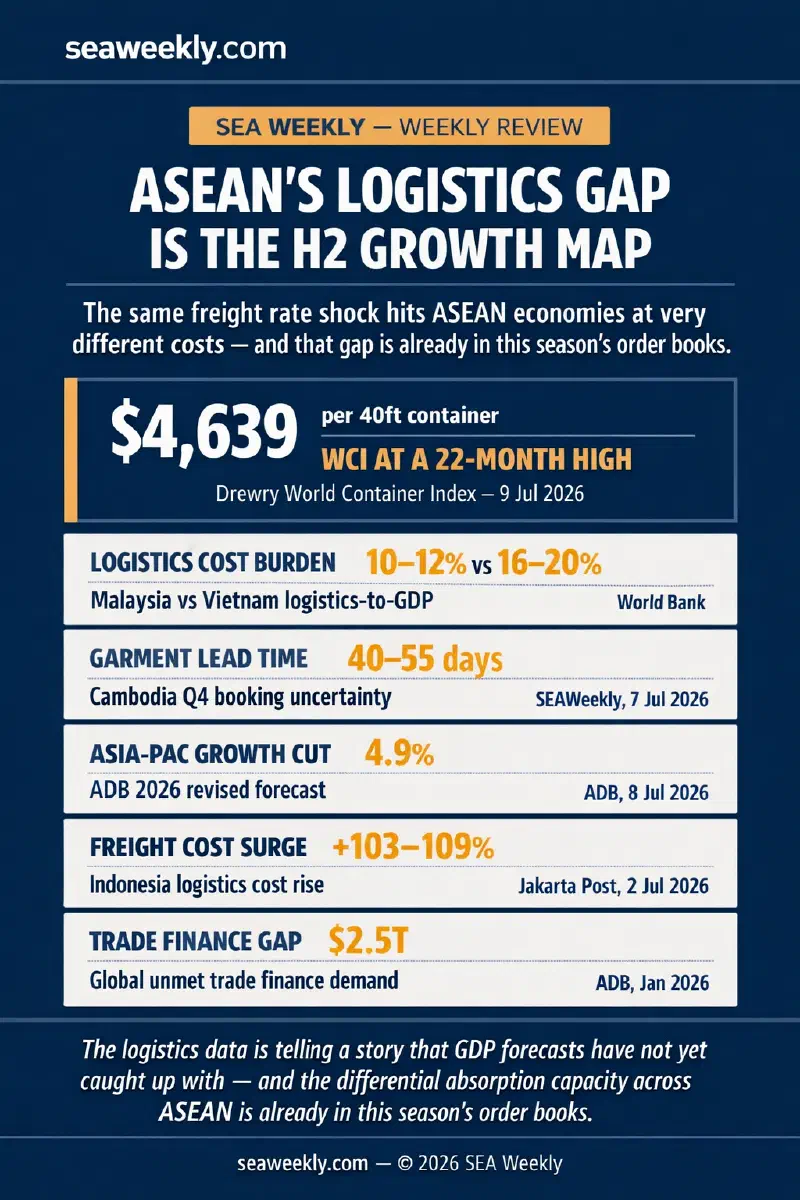
On Tuesday this week, the ADB published its July 2026 Asian Development Outlook and lowered the growth forecast for developing Asia and the Pacific to 4.9% for 2026 — down from 5.5% last year, down 0.2 percentage points from its April estimate, with Southeast Asia explicitly cited among the subregions being trimmed (ADB, 8 July 2026). On Thursday, Drewry published its weekly World Container Index: $4,639 per 40-foot container, the highest since September 2024.
Those two data points landed two days apart. They are measuring the same economy. One arrived weeks after the other already predicted it.
Why the Drewry index is no longer just a shipping story #
Freight analysts have always tracked container rates as a demand barometer — when the global economy is growing, boxes move; when it slows, rates soften. That relationship is real. But it captures backward momentum, not forward positioning. The more useful read on the current WCI trajectory is different: it is a financial stress test, and which ASEAN economies pass it is already being decided before the GDP data knows the question has been asked.
The mechanism works like this. When freight rates rise, a manufacturer’s working capital cycle extends proportionally: the cost of moving a container to market is now embedded in a receivable that takes longer to finance. The exporter either absorbs the margin or seeks a trade finance facility to bridge the gap. On a 90-day receivable book running at current WCI levels — $6,482 on Shanghai–Los Angeles, $4,933 on Shanghai–Rotterdam as of July 9 — an ASEAN electronics or garment exporter’s incremental financing demand is meaningfully higher than it was in January. The bank that prices and books that facility is, with near-certainty, doing so from Singapore.
DBS’s completion of the first significant risk transfer by a Singapore bank — a $1 billion corporate loan portfolio transferred to third-party investors in late June — was strategic pre-positioning for exactly this demand cycle, not defensive balance-sheet management (The Business Times, 30 June 2026). The bank’s CET1 ratio was 16.9% at end-March. This was a move to free regulatory capital for new lending capacity precisely when the Q3 freight cycle would generate new demand. Deputy Prime Minister Gan Kim Yong’s framing at the Association of Banks in Singapore dinner on June 25 — that “a more fragmented world needs trusted connectors” — is not just positioning rhetoric (MAS, 25 June 2026). It is a description of what Singapore’s banks are structurally positioned to capture. The ADB’s January 2026 estimate put the global trade finance gap at $2.5 trillion, with 80% of banks expecting demand to rise as supply chains diversify (ADB, 15 January 2026). That gap does not narrow when freight rates are at 22-month highs.
Daniel Lim’s analysis on Monday argued that Singapore’s trade finance hub positioning is structural, not cyclical. I’d go further: the Q3 freight spike is the stress test that proves the structural case. Singapore doesn’t just benefit from rising trade finance demand — it benefits disproportionately from rising trade finance complexity, because the most difficult cross-border instruments route through the deepest liquidity pool. When every other ASEAN economy is straining under higher working capital costs, the institutions that can reduce that cost or bridge that gap are demonstrating compounding value.
The order-book signal no official statistic tracks #
The single most important leading indicator in this week’s articles does not appear in any government data release. It is the H2 garment order booking window.
Tuesday’s deep dive on Cambodia versus Laos established that sourcing managers at H&M, Inditex, and PVH are finalising Q4 replenishment orders right now — with the window closing in approximately three weeks. The orders filling October and November retail shelves are being allocated based on today’s freight reality, not Q3 average rates. At $4,530 per 40ft (the level on July 2 when most of this week’s articles were calibrated), a Cambodian garment factory quoting an October delivery was absorbing freight costs approximately 35–40% higher than late-2024 baselines. The additional landed burden on a $200 FOB shirt is $15–20 per unit at spot. That does not disappear into the margin silently — it becomes a renegotiation, a cancelled order, or a deferred season.
Cambodia’s lead-time expansion from 35–42 days to 40–55 days under Q3 2026 conditions may sound manageable in isolation. The 15-day variance at either end is not. Buyers managing Q4 restocking cannot plan inventory on a three-week uncertainty band when their own shelf-fill commitments are fixed. The orders that leave Cambodia right now are the ones that survive; the ones delayed by freight uncertainty do not come back in this cycle.
This is a leading indicator for Cambodia’s Q4 GDP that will not appear in any September data release. It is visible now, in the logistics signals, to anyone willing to read them as macro data rather than trade data.
The logistics-cost divergence map #
Wednesday’s article on Malaysia’s electronics logistics efficiency contained the most structurally important comparison in this week’s package: Malaysia’s logistics-cost-to-GDP ratio of 10–12% against Vietnam’s 16–20%, Indonesia’s 14–16%, and Thailand’s 12–14%. The World Bank benchmarking behind these numbers measures accumulated infrastructure investment decisions made over decades. But the consequences of those historical decisions are landing in real-time Q3 2026 order-allocation spreadsheets.
A Malaysian electronics exporter and a Vietnamese peer shipping comparable products to a European buyer both face the same Drewry WCI number. But the Malaysian exporter absorbs each 10% move in container rates approximately 30–50% less severely, because the logistics cost line as a share of total delivered cost is structurally lower. When procurement teams are running sensitivity analyses on Q3 and Q4 order quantities, that asymmetry is not theoretical — it shows up as a competitive advantage in the delivered-cost comparison that determines where the order goes.
This is the “logistics as leading indicator” thesis made concrete. The efficiency differential is already translating into investment allocation decisions. Penang’s RM15.2 billion in approved FDI in the first nine months of 2025 and the continued inflow of US, Chinese, and Cayman Islands capital into the E&E cluster are not primarily being driven by wage comparisons. They are being driven by the total delivered-cost calculation — and logistics efficiency is a growing component of that calculation as global freight rates remain structurally elevated.
Vietnam’s infrastructure bet as a multi-year signal #
Thursday’s Vietnam corridor analysis documented a set of investment decisions that are simultaneously 2026 capital allocation signals and 2028–2030 freight-cost removal events.
PSA International’s agreement to jointly develop four deep-sea container berths at Lach Huyen Port in Haiphong — with the first two berths targeting completion in 2028 and full 4.5 million TEU annual capacity by 2035 — is the kind of infrastructure commitment that changes logistics cost trajectories at the national level (VIR, 9 July 2026). The deep-sea access removes the transshipment premium — currently via Singapore or Kaohsiung — that Vietnamese exporters pay on every container. When berths one and two open in 2028, that premium disappears for manufacturers positioned in the northern corridor. For procurement teams doing H2 2026 through 2027 production allocation, the trajectory matters as much as the current rate.
Vietnam’s H1 2026 metrics — $13.03 billion in realised FDI at a five-year high, manufacturing absorbing 82.6%, electronics exports running at $71.16 billion through June at +49.1% on-year — are the output of an infrastructure bet that was made years earlier (VIR, H1 2026 FDI data). The Lach Huyen investment is the next iteration of that same bet. And it is visible now, in the logistics data, years before it shows up in GDP accounts.
What ADB’s growth revision missed #
The ADB’s July 8 forecast revision is important. It is also, by construction, backward-looking: it captured the energy shock’s impact on domestic demand, tourism, and import costs that were already embedded in the data by late June. What it did not — cannot — capture is the forward differential in ASEAN logistics absorption capacity that determines which economies sustain their H2 trajectory and which are already in a squeeze the Q3 data will confirm.
Friday’s analysis on Indonesia and the Philippines provided the clearest illustration of this gap. Indonesia controls roughly half of global nickel reserves. Its commodity export thesis should benefit when global demand is firm. Instead, the Indonesian Employers Association was telling the Quarantine Agency last week that logistics costs have risen 103 to 109 percent from geopolitical shocks (Jakarta Post, 2 July 2026). The vessel pool competition with the Philippines’ record food import surge is the mechanism that turns a commodity advantage into a margin squeeze. That dynamic is not in the ADB’s 4.9% headline. It is in the logistics data.
The uncomfortable truth is that the traditional ASEAN growth forecasting toolkit — GDP models, PMI readings, FDI announcements — is increasingly a lagging instrument in a supply chain environment that moves in weeks, not quarters. The WCI at $4,639 on Thursday, the Cambodia order-book window closing in three weeks, DBS’s SRT freeing capital for new trade facilities, PSA committing deep-sea berths to Haiphong — these are the signals that describe H2 2026 before H2 2026 arrives.
They are not easy to aggregate into a single number. That is exactly why they are more useful than the ones that are.
References
- ADB (8 July 2026). “ADB Sees Slower Growth for Asia and the Pacific in 2026 Amid Global Energy Crisis.” https://www.adb.org/news/adb-sees-slower-growth-asia-and-pacific-2026-amid-global-energy-crisis (Accessed 11 July 2026)
- Drewry (9 July 2026). “World Container Index — 09 Jul.” https://www.drewry.co.uk/supply-chain-advisors/supply-chain-expertise/world-container-index-assessed-by-drewry (Accessed 11 July 2026)
- The Business Times (30 June 2026). “DBS completes US$1 billion significant risk transfer deal, first Singapore bank.” https://www.businesstimes.com.sg/companies-markets/dbs-completes-us1-billion-significant-risk-transfer-deal-first-singapore-bank (Accessed 11 July 2026)
- MAS (25 June 2026). “Singapore as a Trusted Connector in a Changing World.” https://www.mas.gov.sg/news/speeches/2026/singapore-as-a-trusted-connector-in-a-changing-world (Accessed 11 July 2026)
- ADB (15 January 2026). “Demand for Trade Finance to Rise amid Supply Chain Realignment — ADB Report.” https://www.adb.org/news/demand-trade-finance-rise-amid-supply-chain-realignment-adb-report (Accessed 11 July 2026)
- ADB (12 June 2026). “ADB Delivers Rapid Support as Middle East Impact Spreads.” https://www.adb.org/news/adb-delivers-rapid-support-middle-east-impact-spreads (Accessed 11 July 2026)
- FreightWaves (30 June 2026). “Wartime Economy: Maersk Lifts Full-Year Guidance on Strong Demand.” https://www.freightwaves.com/news/wartime-economy-maersk-lifts-full-year-guidance-on-strong-demand (Accessed 11 July 2026)
- Jakarta Post (2 July 2026). “Businesses Urge Easing of Quarantine Rules Amid Rising Logistics Costs.” https://www.thejakartapost.com/business/2026/07/02/businesses-urge-easing-of-quarantine-rules-amid-rising-logistics-costs (Accessed 11 July 2026)
- Vietnam Investment Review (2026). “Vietnam’s Realised FDI Reaches Five-Year High in First Half.” https://vir.com.vn/vietnams-realised-fdi-reaches-five-year-high-in-first-half-156057.html (Accessed 11 July 2026)
- Vietnam Investment Review (9 July 2026). “PSA, Vietnam to Develop Container Berths at Lach Huyen Port in Haiphong.” https://vir.com.vn/psa-vietnam-to-develop-container-berths-at-lach-huyen-port-in-haiphong-156058.html (Accessed 11 July 2026)