
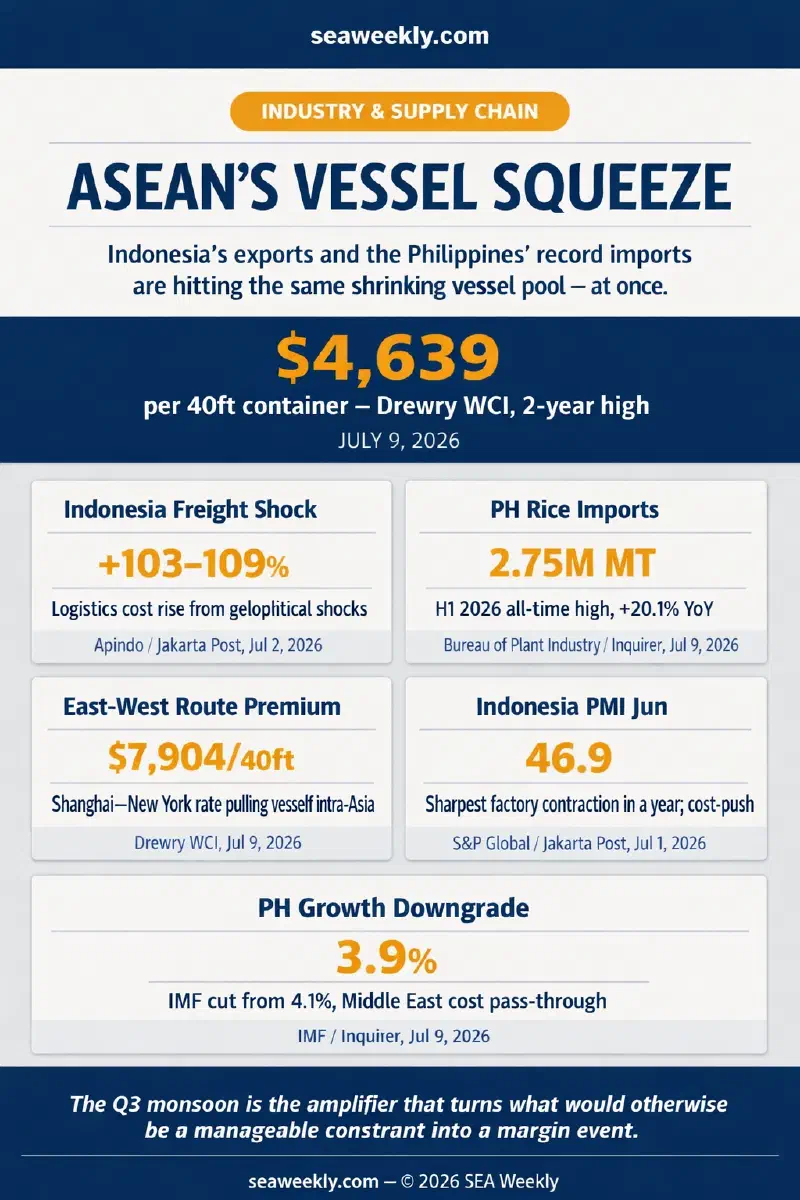
The vessel that arrived at Makassar last Tuesday to load Sulawesi nickel ore was the same type of vessel the Philippines needed to carry Vietnamese rice into Manila South Harbor that week. That is not a metaphor. It is the mundane mechanics of how Q3 2026’s commodity freight crunch is actually operating across ASEAN — not as a headline freight rate story, but as a quiet allocation fight that the Drewry World Container Index number, which hit $4,639 per 40-foot container on July 9, its highest level since September 2024, does not fully capture.
The Two-Sided Squeeze #
This article’s title uses the word “competition.” That framing needs precision. Indonesia and the Philippines are not literally bidding against each other for the same vessels in a spot market. The structural dynamic is different and more important: both countries’ commodity trade is generating simultaneous freight demand that collectively strains the regional vessel pool available for intra-Asia cargo movements — and that pool has been systematically thinned by the economics of East-West route premiums.
When Drewry reports that CMA CGM will charge $7,000 per 40-foot container on Asia–Europe from July 15, or that the Shanghai–New York rate stands at $7,904, carriers respond rationally by maximizing East-West lane utilization. Intra-Asia freight — which moves on shorter routes, with thinner margins, and competes for residual vessel capacity — absorbs whatever is left. Indonesia’s bulk commodity exports and the Philippines’ food imports are both in that residual pool. The Q3 monsoon season is the amplifier that turns what would otherwise be a manageable constraint into a margin event.
Indonesia’s Export Freight Wall #
I have spent enough time at Tanjung Priok and Makassar to know that the phrase “logistics cost” abstracts something that is genuinely physical. Ships berth, discharge, load, and depart on a schedule that is coordinated across dozens of variables: tides, pilot availability, terminal slot assignments, weather routing for the coastal feeder legs. When the Indonesian Employers Association told the Quarantine Agency last week that logistics costs have risen 103 to 109 percent from geopolitical shocks, they were describing the accumulation of those variables under pressure — not just a freight rate number (Jakarta Post, July 2, 2026).
The commodity volumes involved are not small. Indonesia is the world’s largest coal exporter, moving roughly 500 million tons annually through Kalimantan and Sumatra loading terminals. Palm oil exports add tens of millions more tons through Sumatra ports. Nickel pig iron and mixed hydroxide precipitate from Morowali Industrial Park and Weda Bay Estate — which I covered in my July 3 analysis of nickel logistics cost pressures — require feeder movements from Sulawesi before joining ocean carriers out of Surabaya.
In July, all of those movements interact with monsoon geography. The Banda Sea, Molucca Sea, and Flores Sea — the inter-island shipping lanes connecting the industrial park ports to the main export hubs — are in peak monsoon conditions. High swells and squalls push feeder vessel schedules. When weather windows tighten, departures that would normally spread across the month concentrate into two or three windows, and vessels queue for the same berth and pilot slots simultaneously.
Layer on top of that the domestic coal restocking dynamic. Indonesian state utility PLN’s coal supply constraints for coal-fired power plants — which caused electricity disruptions in multiple regions through Q2 — were only declared resolved in late June (Antara, June 26, 2026). The medium-rank coal required by PLN (approximately 5,200 kcal/kg GAR, capped at $70 per ton under the Domestic Market Obligation) moves on coastal bulk carriers from Kalimantan and Sumatra. That domestic restocking flow is competing for regional vessel slots with the export coal flow moving to China and Korea. Indonesia is not just competing with the Philippines for ASEAN vessel capacity — it is competing with itself, across the export–domestic cargo split, within the same monsoon window.
The June manufacturing PMI data confirms the cost environment. Indonesia’s S&P Global Manufacturing PMI collapsed to 46.9 in June from 50.0 in May, with input price inflation accelerating to its most pronounced level since September 2013 — nearly a 13-year record — and new export orders posting their steepest decline since August 2021 (Jakarta Post, July 1, 2026). The Pertamina Pride tanker exiting the Strait of Hormuz on July 9, carrying 2 million barrels of Saudi crude, captured the broader point: Indonesia’s energy and commodity supply chains are navigating a geopolitical shock that is simultaneously raising costs and creating vessel scheduling uncertainty (Jakarta Post, July 9, 2026).
The Philippines Is Not a Passive Victim #
Lourdes’s take: The standard narrative positions the Philippines as a smaller economy absorbing freight costs that larger exporters determine. That is partially correct, but it misses the sourcing reality of Q3 2026.
The Philippines imported 2.75 million metric tons of rice in the first six months of this year — a record level, up 20.1 percent from the same period in 2025 (Philippine Daily Inquirer, July 9, 2026). The US Department of Agriculture projects total rice import arrivals to rise to 5.2 million metric tons for marketing year 2026–27, implying another 2.45 million metric tons still to arrive through the second half. That volume is landing in Q3 at precisely the same moment Indonesia’s coal and nickel export flush is hitting regional vessel allocation.
The drivers are domestic: damaged irrigation infrastructure in the Upper Pampanga River system, high fuel and fertilizer prices from the Middle East crisis reducing farm input availability, and the El Niño pre-positioning that pushed traders to stockpile ahead of anticipated production shortfalls. The DA’s characterization of this as a “natural response” is accurate. It is also a massive, concentrated freight demand event.
What distinguishes the Philippines’ exposure from most ASEAN peers is the double-freight mechanism. An imported container of Vietnamese rice landing at Manila South Harbor generates one freight cost — the international container rate now at $4,639 per 40-foot container. The same shipment then moves on a RORO vessel from Manila to Cebu, or on a coastal inter-island freighter from the Visayas hub to Mindanao provincial markets, generating a second freight cost. That second leg is driven not by container rates but by bunker fuel, and the recent removal of tax breaks on kerosene and LPG (Rappler, July 9, 2026) removes a buffer that RORO operators had been relying on since the Middle East crisis began.
The WESM electricity price surge — up 23 percent in June for the Visayas grid, which handles the logistics backbone for much of the southern Philippines distribution network — compounds this at the cold storage and port operations layer. And the OFW remittance inflow that typically cushions Philippine household spending has slowed: April 2026 inflows fell to approximately $2.7 billion, an 11-month low, with growth decelerating to about 2 percent year-on-year as Gulf economies absorbed disruption from the Middle East conflict (Philippine Daily Inquirer, July 1, 2026). The IMF and ADB have both revised the Philippines’ 2026 GDP forecast downward — to 3.9 and 3.8 percent respectively — citing Middle East commodity cost pass-through and weak Q1 domestic demand (Philippine Daily Inquirer, July 9, 2026).
For the families in Cebu and Davao absorbing both ends of this freight chain, the macroeconomic comfort of the Philippines’ recent upper-middle income reclassification by the World Bank does not help with the price of onions this week.
The Vessel Pool Is Smaller Than Either Story Assumes #
Here is what the individual country coverage tends to miss: the intra-Asia vessel pool available for commodity trade has been structurally reduced by the same East-West rate spike that makes the global freight story so dramatic.
At $4,639 per 40-foot container on the global composite index and $7,904 on Shanghai–New York — both as of July 9 — the economics of deploying vessels on East-West routes are overwhelmingly favorable. Carriers maximizing lane utilization on Transpacific and Asia–Europe routes are not leaving vessels idle for intra-Asia repositioning. CMA CGM’s announcement of FAK rates of $7,000 per 40-foot on Asia–Europe and $7,900–$8,500 on Asia–Med from July 15 signals that the premium will widen further (Drewry World Container Index, July 9, 2026). International Container Terminal Services (ICTSI), the Philippines’ dominant port operator, reported 21 percent net income growth and 18 percent throughput growth in Q1 2026 — throughput at 4.08 million TEUs confirms that volumes are not falling; they are competing for terminal capacity that is already under pressure (Philippine Daily Inquirer, July 10, 2026).
The result is that Indonesia’s commodity exporters and Philippine food importers are both drawing on a regional vessel pool that is smaller than volumes require, with the shortfall papered over by scheduling delays, demurrage, and bunker cost increases that become visible only at the margin level of the actual cargo operators.
The Q4 Test #
This is not simply a monsoon problem. The Q3 monsoon season creates operational concentration — weather windows that bunch vessel schedules — but the underlying capacity dynamic will not automatically resolve when August gives way to September.
The relief scenario requires either a normalisation of Hormuz tensions (bringing global rates down and reducing the economics of East-West route premium bias) or a meaningful easing of Q3 demand peaks that frees regional vessel capacity. Neither appears imminent. USDA’s projection of 5.2 million metric tons of rice imports in marketing year 2026–27 implies continued high freight demand from the Philippines into Q4. Indonesia’s nickel and coal downstream export push, backed by the government’s RKAB production control mechanism and Prabowo’s aggressive Batam maritime investment push ($4.2 billion invested in 2025), suggests that Indonesian commodity freight volumes are a structural feature, not a Q3 anomaly (Antara, June 17, 2026; Jakarta Post, July 8, 2026).
The Q4 question for ASEAN is whether the intra-Asia vessel pool expands faster than the commodity volume growth from two of the region’s largest economies. Based on the current trajectory of East-West rate premiums and carrier deployment decisions, the answer is probably no. That means the Q3 friction visible in demurrage queues and inter-island price spikes is not a seasonal inconvenience. It is a preview of what H2 2026 looks like for ASEAN commodity supply chains if neither the demand pressure nor the vessel allocation dynamic shifts.
References #
- Drewry Shipping Consultants (July 9, 2026). “World Container Index — 09 Jul.” https://www.drewry.co.uk/supply-chain-advisors/supply-chain-expertise/world-container-index-assessed-by-drewry (Accessed July 10, 2026)
- The Jakarta Post (July 1, 2026). “RI factories slide into contraction in June amid soaring costs, weak demand.” https://www.thejakartapost.com/business/2026/07/01/ri-factories-slide-into-contraction-in-june-amid-soaring-costs-weak-demand (Accessed July 10, 2026)
- The Jakarta Post (July 2, 2026). “Businesses urge easing of quarantine rules amid rising logistics costs.” https://www.thejakartapost.com/business/2026/07/02/businesses-urge-easing-of-quarantine-rules-amid-rising-logistics-costs (Accessed July 10, 2026)
- ANTARA News (June 26, 2026). “Indonesia says coal supply constraints for power plants resolved.” https://en.antaranews.com/news/420517/indonesia-says-coal-supply-constraints-for-power-plants-resolved (Accessed July 10, 2026)
- ANTARA News (June 17, 2026). “RKAB as tool to control critical minerals: ESDM Ministry.” https://en.antaranews.com/news/419403/rkab-as-tool-to-control-critical-minerals-esdm-ministry (Accessed July 10, 2026)
- The Jakarta Post (July 8, 2026). “Prabowo touts Batam as Indonesia’s next global maritime, investment gateway.” https://www.thejakartapost.com/business/2026/07/08/prabowo-touts-batam-as-indonesias-next-global-maritime-investment-gateway (Accessed July 10, 2026)
- The Jakarta Post (July 9, 2026). “Pertamina tanker exits Strait of Hormuz amid renewed US-Iran tensions.” https://www.thejakartapost.com/business/2026/07/09/pertamina-tanker-exits-strait-of-hormuz-amid-renewed-us-iran-tensions (Accessed July 10, 2026)
- The Jakarta Post (July 10, 2026). “New industry council risks more rhetoric than reform.” https://www.thejakartapost.com/business/2026/07/10/new-industry-council-risks-more-rhetoric-than-reform (Accessed July 10, 2026)
- Philippine Daily Inquirer (July 9, 2026). “Rice imports reached all-time high in first semester.” https://business.inquirer.net/599531/rice-imports-reached-all-time-high-in-first-semester (Accessed July 10, 2026)
- Philippine Daily Inquirer (July 9, 2026). “IMF, ADB slash PH growth forecast.” https://business.inquirer.net/599521/imf-adb-slash-ph-growth-forecast (Accessed July 10, 2026)
- Philippine Daily Inquirer (July 1, 2026). “ING: PH trails Asia in consumer recovery.” https://business.inquirer.net/598126/ing-ph-trails-asia-in-consumer-recovery (Accessed July 10, 2026)
- Philippine Daily Inquirer (July 10, 2026). “ICTSI closes acquisition of Brazil firm.” https://business.inquirer.net/599694/ictsi-closes-acquisition-of-brazil-firm (Accessed July 10, 2026)
- Rappler (July 9, 2026). “Tax breaks on kerosene, LPG end. How will this affect prices?” https://www.rappler.com/business/tax-breaks-kerosene-lpg-end-how-will-this-affect-prices/ (Accessed July 10, 2026)