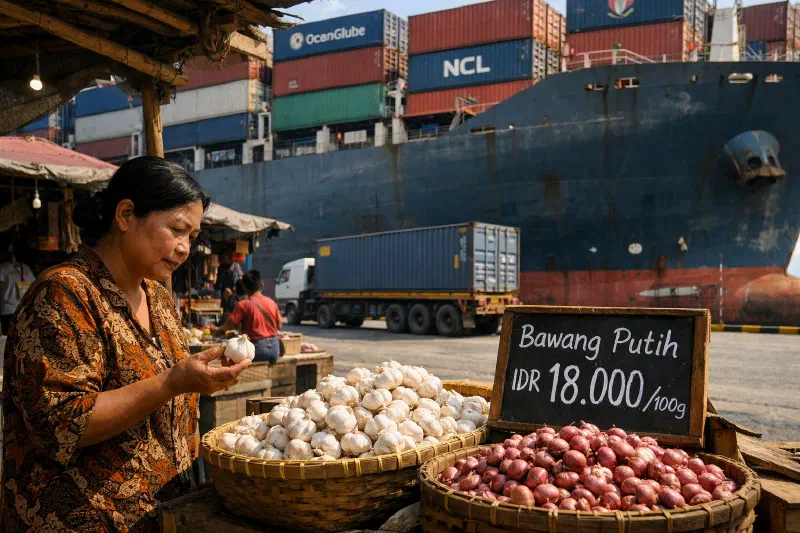
When Statistics Indonesia (BPS) released its June CPI report on July 1, the price of garlic appeared in the data as a contributor to headline inflation. The reason cited: “higher logistics costs and the weakening of the rupiah.” That sentence, appearing in an official statistical release rather than an analyst note, is the freight-to-consumer-price transmission mechanism in its most literal form.
Three channels, different speeds #
The conversation around freight costs and inflation usually runs through a single channel: oil prices rise, fuel prices rise, transport costs rise, CPI rises. That channel is real, but it is also the fastest and most visible — and by the time it appears in monthly CPI data, it has usually already been priced by markets.
The pass-through that matters more for Q3 and Q4 is quieter and slower. There are two additional channels operating in parallel.
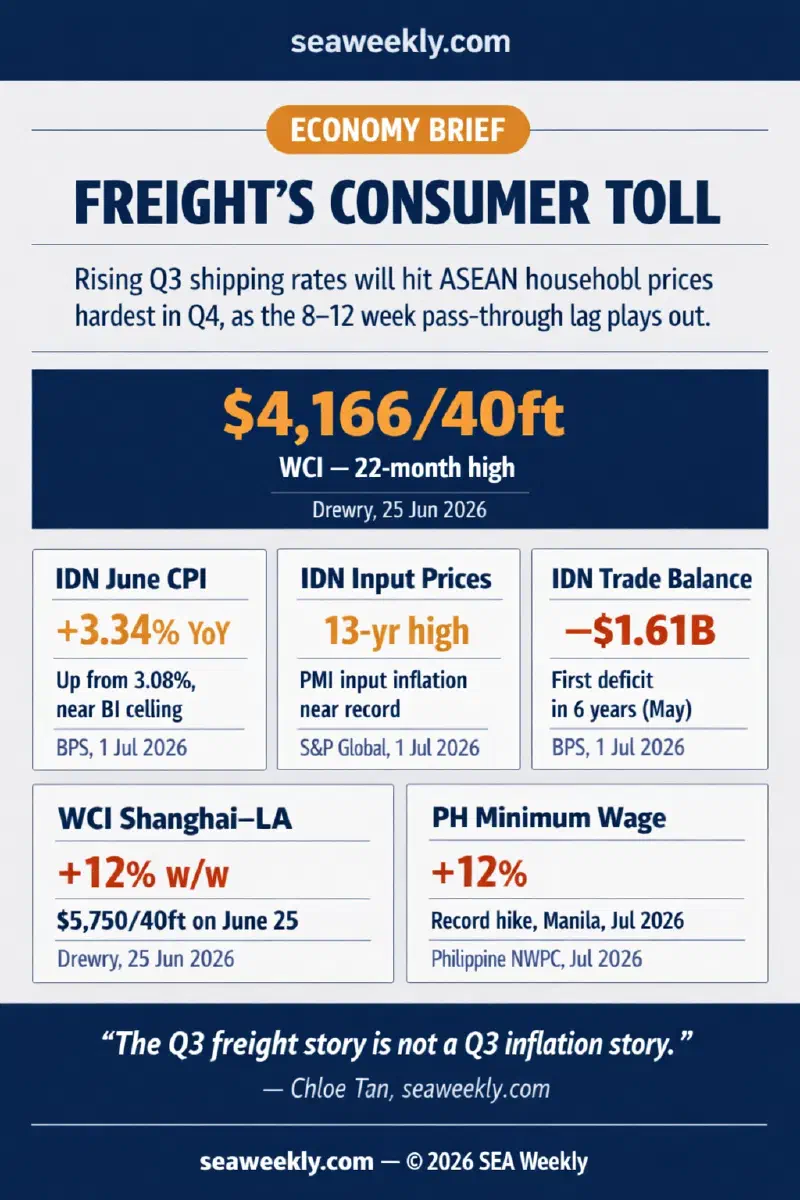
The import cost channel moves at medium speed: container rate increases raise the landed cost of imported food, consumer goods, and industrial inputs. This typically takes four to eight weeks to clear through distributor margins and reach retail prices. The Drewry World Container Index hit $4,166 per 40-foot container on June 25 — its highest level in 22 months, after a 5% weekly jump — with the Shanghai–Los Angeles rate up 12% to $5,750 and Shanghai–New York up 6% to $7,149 (Drewry, June 25, 2026). DHL’s June ocean-freight update put global demand at 4% above year-ago levels against fleet capacity growth of only 3%, with Suez Canal detours still constraining effective slot availability (DHL, June 2026).
The production input channel is the slowest, running eight to twelve weeks from rate change to retail shelf. Manufacturers absorbing higher raw material and logistics costs eventually pass them through to final goods prices — but the timing depends on contract structures, competitive pressure, and inventory levels.
June’s consumer price data across ASEAN is therefore recording the lag from April–May freight conditions, not June’s. That distinction is not a technicality. It is the most important variable in the Q3 inflation outlook.
Indonesia: the mechanism visible in the data #
Indonesia’s June CPI reached 3.34% year-on-year, up from 3.08% in May, and approached the upper end of Bank Indonesia’s 1.5%–3.5% target band (The Jakarta Post, July 1, 2026). The transportation component recorded the largest monthly increase, at 2.29% month-on-month and contributing 0.28 percentage points to headline inflation. Annual transportation inflation of 4.57% contributed 0.55 percentage points — the single largest group contribution.
These numbers reflect two Pertamax price increases in June (June 1 and June 10, following the Dexlite and Pertamax Turbo sequence from earlier in the month) — the energy channel at work. But the food items within the BPS data tell the logistics-cost story directly. Garlic contributed 0.03 percentage points to monthly inflation, with BPS specifically attributing the increase to higher logistics costs and rupiah weakness. Rice contributed 0.02 percentage points. Red shallots contributed 0.04 percentage points.
The implications for Q3 compound when read alongside the broader Indonesia economic picture. The S&P Global Indonesia Manufacturing PMI collapsed to 46.9 in June from 50.0 in May — the sharpest contraction in a year — with input price inflation accelerating to its highest level since September 2013, a near-record in the survey’s history (The Jakarta Post, July 1, 2026). That input cost pressure has not yet fully cleared into final consumer goods prices. Indonesia’s May trade balance recorded a deficit of $1.61 billion — the first since April 2020 — as oil and gas imports surged 71% year-on-year to $4.51 billion, while oil and gas exports fell 32% to $760 million (The Jakarta Post, July 1, 2026).
The import surge is a pass-through accumulator. Every additional dollar of oil imports flowing through Pertamina’s logistics chain becomes a cost the economy must absorb — either through subsidies, through fuel prices, or through the inflation that follows a weaker rupiah.
Philippines: the food import exposure problem #
The Philippines faces a different but connected vulnerability. In SEA Weekly’s June 8 analysis of Philippine consumption, the structural dependence on food imports — and the inter-island shipping costs embedded in their distribution — was identified as the key downside risk for household spending. That risk is now being tested.
Philippines inter-island freight costs are heavily tied to bunker fuel prices. When marine fuel rises, the cost of moving rice from Mindanao surplus provinces to Metro Manila deficits rises within two to three weeks — a much faster pass-through lag than container shipping. The country’s food import basket (garlic, onions, processed foods, cooking oil) faces the full force of the import cost channel simultaneously.
The government’s approval of a 12% minimum wage increase for Metro Manila workers — in two tranches, starting this month — is a formal acknowledgment that the cost-of-living pressure is structural rather than transient (VnExpress International, July 2, 2026). Minimum wage adjustments of this magnitude — the largest in years — signal that the BSP’s stated inflation band is not describing the lived reality for a significant share of the population.
As I noted in my June 11 analysis of ASEAN fiscal space, the Philippines has historically run thinner consumer fuel subsidies than Indonesia or Thailand. That reduces fiscal shock but accelerates pass-through. Lower buffers mean faster transmission when freight costs spike.
Vietnam: margins, not baskets #
Vietnam’s exposure runs through a different channel. The economy expanded at 7.83% in Q1 2026, the fastest rate in 16 years, and the country is a net exporter of rice, key vegetables, and seafood — which provides partial insulation against the food import channel that is hitting Indonesia and the Philippines.
But Vietnam’s manufacturers are absorbing freight cost increases in input costs rather than consumer prices — compressing margins to stay competitive on export orders. As SEA Weekly’s June 17 analysis of Vietnam logistics costs noted, rising input costs have arrived just as producers are repricing contracts. The consumer CPI story in Vietnam is quieter than in Indonesia; the margin erosion story is acute.
For imported consumer goods — electronics, processed foods, household appliances — Vietnamese consumers face the same import cost channel as the rest of the region. The difference is that Vietnam’s strong export performance gives the economy more nominal income to absorb those costs.
The timing problem central banks need to read #
The most consequential point in this brief is not about Q3 CPI data. It is about when Q3 freight costs arrive in Q3 data.
The Drewry WCI spike of June 25 — the 22-month high at $4,166 per 40-foot container — will begin reaching retail shelves in Southeast Asia in approximately late August. The full pass-through lands in September and October. South Korea’s CPI, which accelerated to 3.2% in June (a 2.5-year high) driven by precisely the same oil and freight cost dynamic, suggests what the lagged ASEAN read will look like by Q4 (Reuters/CNA, July 2, 2026).
The practical risk for monetary policy: central banks reading Q3 CPI data as evidence of stabilizing inflation will be looking at freight conditions from April and May. The freight surge they should be pricing — the one that peaked in late June — has not yet cleared into the data. Bank Indonesia is already at elevated rates after its out-of-schedule June hike. The BSP is navigating above its target band. If either central bank reads Q3 headline prints as evidence that the inflation cycle is peaking and moves toward normalisation, they will be meeting the Q4 pass-through wave coming the other direction.
The Q3 freight story is not a Q3 inflation story. The question worth asking now is not what July’s CPI will print. It is whether September’s decision-makers in Jakarta and Manila will be pricing in the freight environment of late June when they sit down to set rates.
References:
- The Jakarta Post (July 1, 2026). “Rising fuel, food prices drive June inflation close to BI’s target ceiling.” https://www.thejakartapost.com/business/2026/07/01/rising-fuel-food-prices-drive-june-inflation-close-to-bis-target-ceiling (Accessed July 2, 2026)
- The Jakarta Post (July 1, 2026). “RI factories slide into contraction in June amid soaring costs, weak demand.” https://www.thejakartapost.com/business/2026/07/01/ri-factories-slide-into-contraction-in-june-amid-soaring-costs-weak-demand (Accessed July 2, 2026)
- The Jakarta Post (July 1, 2026). “Indonesia posts first trade deficit in six years.” https://www.thejakartapost.com/business/2026/07/01/indonesia-posts-first-trade-deficit-in-six-years (Accessed July 2, 2026)
- Drewry (June 25, 2026). “World Container Index Assessed by Drewry.” https://www.drewry.co.uk/supply-chain-advisors/supply-chain-expertise/world-container-index-assessed-by-drewry (Accessed June 29, 2026)
- DHL (June 2026). “Ocean Freight Market Update.” https://www.dhl.com/th-en/home/global-forwarding/latest-news-and-webinars/ocean-freight-market-update.html (Accessed June 29, 2026)
- VnExpress International (July 2, 2026). “Philippines approves record 12% minimum wage hike for Manila workers.” https://e.vnexpress.net/news/business/economy/philippines-approves-record-12-minimum-wage-hike-for-manila-workers-5092134.html (Accessed July 2, 2026)
- Reuters / CNA (July 2, 2026). “South Korea’s inflation rate quickens to 2-1/2-year high.” https://www.channelnewsasia.com/business/south-koreas-inflation-rate-quickens-2-12-year-high-6226196 (Accessed July 2, 2026)
- Reuters (June 28–29, 2026). “Oil climbs following renewed US-Iran strikes in Middle East.” https://www.reuters.com/business/energy/oil-climbs-following-renewed-us-iran-strikes-middle-east-2026-06-28/ (Accessed June 29, 2026)
- SEA Weekly (June 29, 2026). “How ASEAN freight costs are squeezing supply chain margins as Q3 shipping rates climb.” https://seaweekly.com/posts/2026-06-29-asean-freight-costs-squeezing-supply-chain-margins/ (Accessed July 2, 2026)
- SEA Weekly (June 17, 2026). “Why Vietnam’s logistics cost trajectory will determine the pace of ASEAN export margin recovery in H2.” https://seaweekly.com/posts/2026-06-17-vietnam-logistics-costs-asean-export-recovery/ (Accessed July 2, 2026)