
The line most ASEAN procurement managers are hearing in July 2026 is not “we don’t have the capacity.” It is “we can get it to you — we just cannot tell you when.” That shift from cost uncertainty to time uncertainty is what makes this manufacturing environment operationally distinct from anything in the post-pandemic normalisation period.

The PMI signal procurement teams are misreading
Vietnam’s June manufacturing PMI came in at 51.8 — down from 52.8 in May but marking the fourteenth consecutive month of expansion. The headline is healthy enough that most analysts moved on. They should have stopped at the sub-indices.
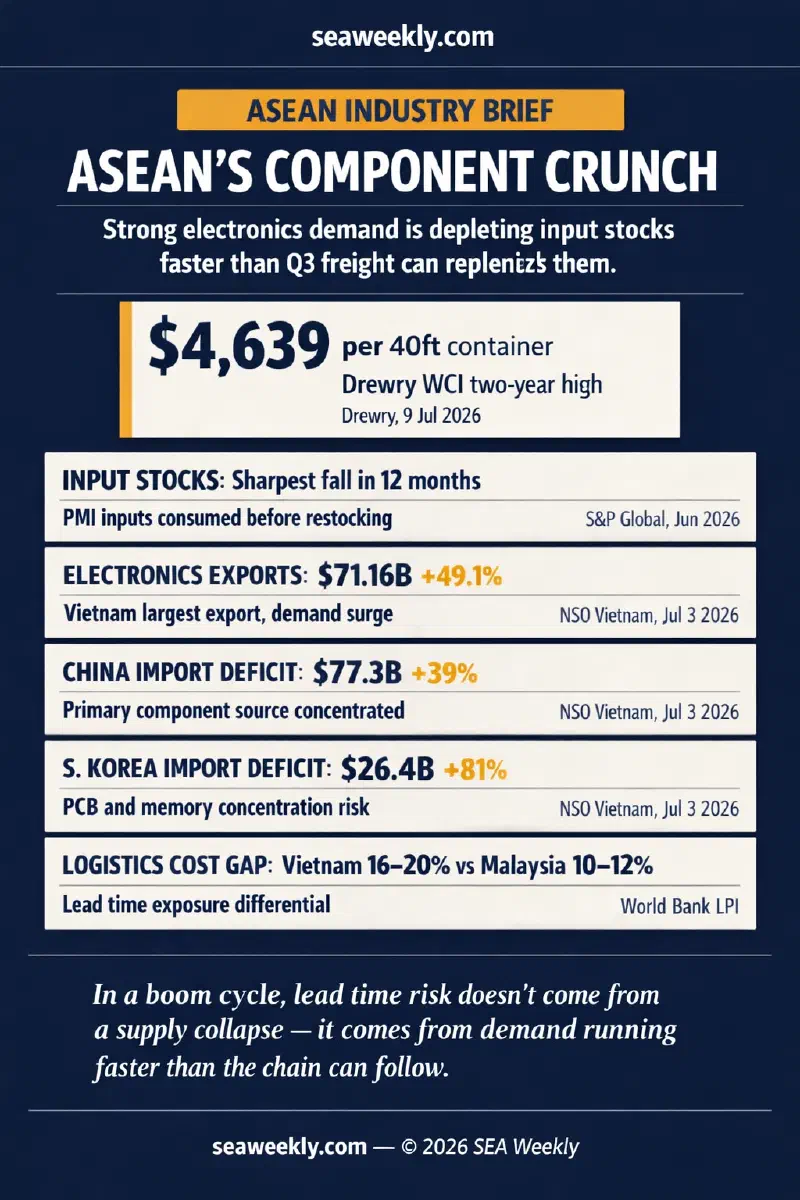
Input stocks decreased at a sharp and accelerated pace in June, registering the most marked fall in a year. The S&P Global commentary identified two causes: inputs being consumed faster to support production growth, and — separately — “challenges in importing goods” (VIR, July 1, 2026). Supplier delivery times lengthened for the fourth consecutive month. Input cost inflation remained sharp, attributed to material supply shortages and higher transportation costs.
That is the diagnostic. The question is why it is happening during a boom, not a disruption.
The demand-concentration problem
The answer lies in the trade data. Vietnam’s electronics and computer exports reached $71.16 billion in the first half of 2026, up 49.1% year-on-year — the country’s largest export category by a wide margin (National Statistics Office, July 3, 2026). Running that level of export output requires a proportionally large and reliable flow of imported components.
The component import structure tells the risk story. Vietnam’s trade deficit with China widened to $77.3 billion in H1 2026, up 39% year-on-year. The deficit with South Korea surged 81% to $26.4 billion. Combined, China and South Korea are responsible for the dominant share of Vietnam’s electronics inputs — multi-layer ceramic capacitors, memory modules, flexible PCBs, advanced connectors, and the intermediate materials that flow into final assembly.
When every electronics manufacturer in Vietnam is expanding simultaneously — realised FDI in manufacturing reached $10.76 billion in H1 2026, the highest five-year first-half level (NSO, July 5, 2026) — procurement teams converge on the same supplier countries at the same time. That competition for allocation is not a supply failure. It is demand running faster than concentrated supply chains were designed to handle.
The counterintuitive point is worth stating plainly: the boom is generating the lead time problem. A 49% export surge is not compatible with unchanged supplier delivery windows from a base of two or three countries.
The freight ceiling moves up again
The timing is particularly difficult. The Drewry World Container Index rose 2% to $4,639 per 40ft container as of July 9, its highest level since September 2024 (Drewry, July 9, 2026). The rate has climbed from $4,166 in late June, through $4,530 by July 2, to its current level — a 11% rise in two weeks.
More significant than the current level is what is coming. CMA CGM has announced FAK rates of $7,000 per 40ft container on Asia-Europe, effective July 15. General rate increases of $2,000–$3,000 per 40ft are also scheduled on the Transpacific from the same date. Drewry noted only three blank sailings announced on Transpacific routes for the coming week, confirming tight effective capacity.
This matters for input restocking because it removes the cost logic for building buffer inventory before Q3. Every manufacturer that might have used July to get ahead of Q3 component demand now faces a material step-up in the delivered cost of doing so. The rational response — continue on lean inventory rather than pre-position at a peak freight cost — is exactly the behaviour that perpetuates lead time volatility through the quarter.
The ASEAN spread
Not all ASEAN electronics manufacturers face this equally. The World Bank logistics cost-to-GDP benchmarks that underpin our July 8 analysis of Malaysia’s competitive position tell part of the story: Vietnam’s logistics costs run at 16–20% of GDP, the highest among ASEAN-6 manufacturing economies. Malaysia’s run at 10–12%, second only to Singapore. Indonesia sits at 14–16%.
Malaysia’s lower logistics cost burden does not immunise it from supplier allocation tensions — Penang’s 350-plus multinationals and 6,500 manufacturing SMEs also source from Chinese and Korean component suppliers. But its lower unit logistics friction means that the same freight rate move costs less per unit of output, and its closer integration with Singapore’s transshipment network gives it more rerouting options when primary routes tighten.
Vietnam, by contrast, is running at the highest logistics cost-to-GDP ratio in the peer group, at a moment when its manufacturing output is growing faster than any comparable ASEAN economy. That combination amplifies every unit of freight rate increase and every day of delivery delay.
What to watch through Q3
The July 15 freight rate increases are the first inflection point. If FAK rates hold at the announced levels, manufacturers will be priced out of buffer restocking for much of July. Lead time volatility will remain elevated through August.
The second indicator is whether Vietnam’s component deficit with China and South Korea narrows or continues to widen. A widening deficit signals procurement teams are continuing to pull forward demand — which maintains pressure on supplier allocation. A narrowing deficit could indicate either slower production or, more constructively, the early signs of localisation beginning to substitute imported inputs.
The deeper structural watch is Vietnam’s Resolution 10 localisation targets — a policy commitment, announced in June, to raise local content in key manufacturing industries to 45–50% by 2030. As we examined in the June 26 analysis of Malaysia versus Vietnam electronics supply chain upgrades, Vietnam is five to seven years from materially reducing its import dependency in core electronics inputs. Until then, every production cycle that exceeds historical growth rates will generate lead time pressure from the same source: concentrated upstream supply struggling to keep pace with a downstream manufacturing boom that no one planned to be this large, this fast.
In a boom cycle, lead time risk does not come from a supply collapse. It comes from demand running faster than the chain can follow.
References:
- S&P Global / Vietnam Investment Review (July 1, 2026). “Manufacturing sector ends the first half of 2026 on a positive note.” https://vir.com.vn/manufacturing-sector-ends-the-first-half-of-2026-on-a-positive-note-155872.html (Accessed July 10, 2026)
- National Statistics Office of Vietnam / Vietnam Investment Review (July 3, 2026). “Vietnam posts trade deficit as imports outpace exports in first half.” https://vir.com.vn/vietnam-posts-trade-deficit-as-imports-outpace-exports-in-first-half-156046.html (Accessed July 10, 2026)
- National Statistics Office of Vietnam / Vietnam Investment Review (July 4, 2026). “Manufacturing boosted by FDI, export recovery and public investment.” https://vir.com.vn/manufacturing-boosted-by-fdi-export-recovery-and-public-investment-156056.html (Accessed July 10, 2026)
- National Statistics Office of Vietnam / Vietnam Investment Review (July 5, 2026). “Vietnam’s realised FDI reaches five-year high in first half.” https://vir.com.vn/vietnams-realised-fdi-reaches-five-year-high-in-first-half-156057.html (Accessed July 10, 2026)
- Drewry Supply Chain Advisors (July 9, 2026). “World Container Index — 09 Jul.” https://www.drewry.co.uk/supply-chain-advisors/supply-chain-expertise/world-container-index-assessed-by-drewry (Accessed July 10, 2026)
- World Bank Logistics Performance Index (2023, referenced). ASEAN logistics cost-to-GDP benchmarks cited in SEA Weekly July 8, 2026 analysis.